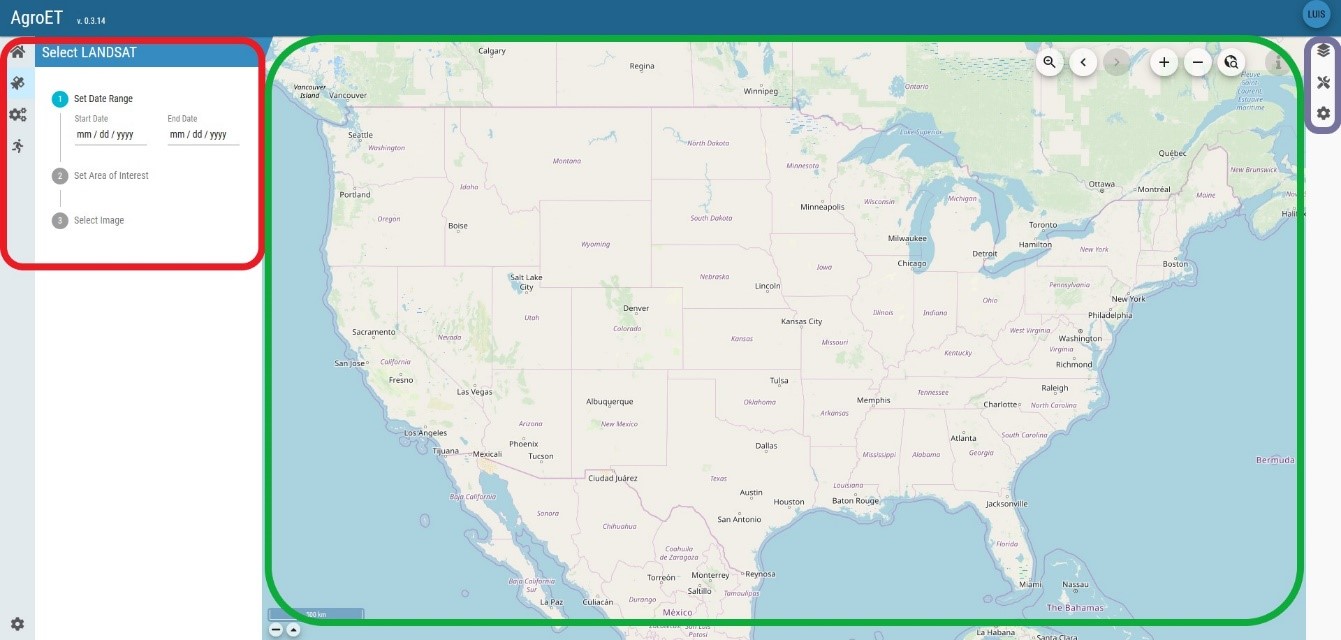

Figure 1. Initial Page of AgroET Graphical User Interface (GUI)
The purple rectangle on the right hand side of Figure 1 contains three icons staked vertically and they allow the user to control the GIS layers display in the middle of the GUI and set some of the characteristics of the GIS layers. The three icons are shown in Figure 2 (a).
Downoad Tutorial
Description of AgroET Graphical User Interface (GUI)
Once the user logs in to AgroET the first screen the GUI displays in shown in Figure 1. The screen is divided into three main sections which are outlined by three polygons in Figure 1. The first section is the model run options and is located in the upper left hand side of the screen where three icons are stacked vertically with some options to the right of them (red rectangle), the second section is the middle of the screen in which a map is displayed with a set of horizontal icons on the top right hand corner to control the map (green rectangle) and third section is on the upper right hand side of the screen where three vertical icons control the GIS layers that are displayed and some GIS settings (purple rectangle).

The purple rectangle on the right hand side of Figure 1 contains three icons staked vertically and they allow the user to control the GIS layers display in the middle of the GUI and set some of the characteristics of the GIS layers. The three icons are shown in Figure 2 (a).